June 8, 2026
New CSO Data Strengthens Evidence Base for the Dublin Belfast Economic Corridor (DBEC)
New analysis from the Central Statistics Office Ireland provides one of the most comprehensive comparative assessments to date of economic conditions across Ireland and Northern Ireland, with direct relevance to the evolving Dublin Belfast Economic Corridor (DBEC).
The findings, published in June 2026, combine regional accounts, income data, housing affordability indicators and sectoral breakdowns, offering a clearer picture of the corridor as a single, interconnected economic geography.
Independent commentary on the release has highlighted the significance of the report in demonstrating both convergence and divergence across the two economies, particularly in relation to housing pressures and productivity structures along the Dublin–Belfast axis.
Key Findings include:
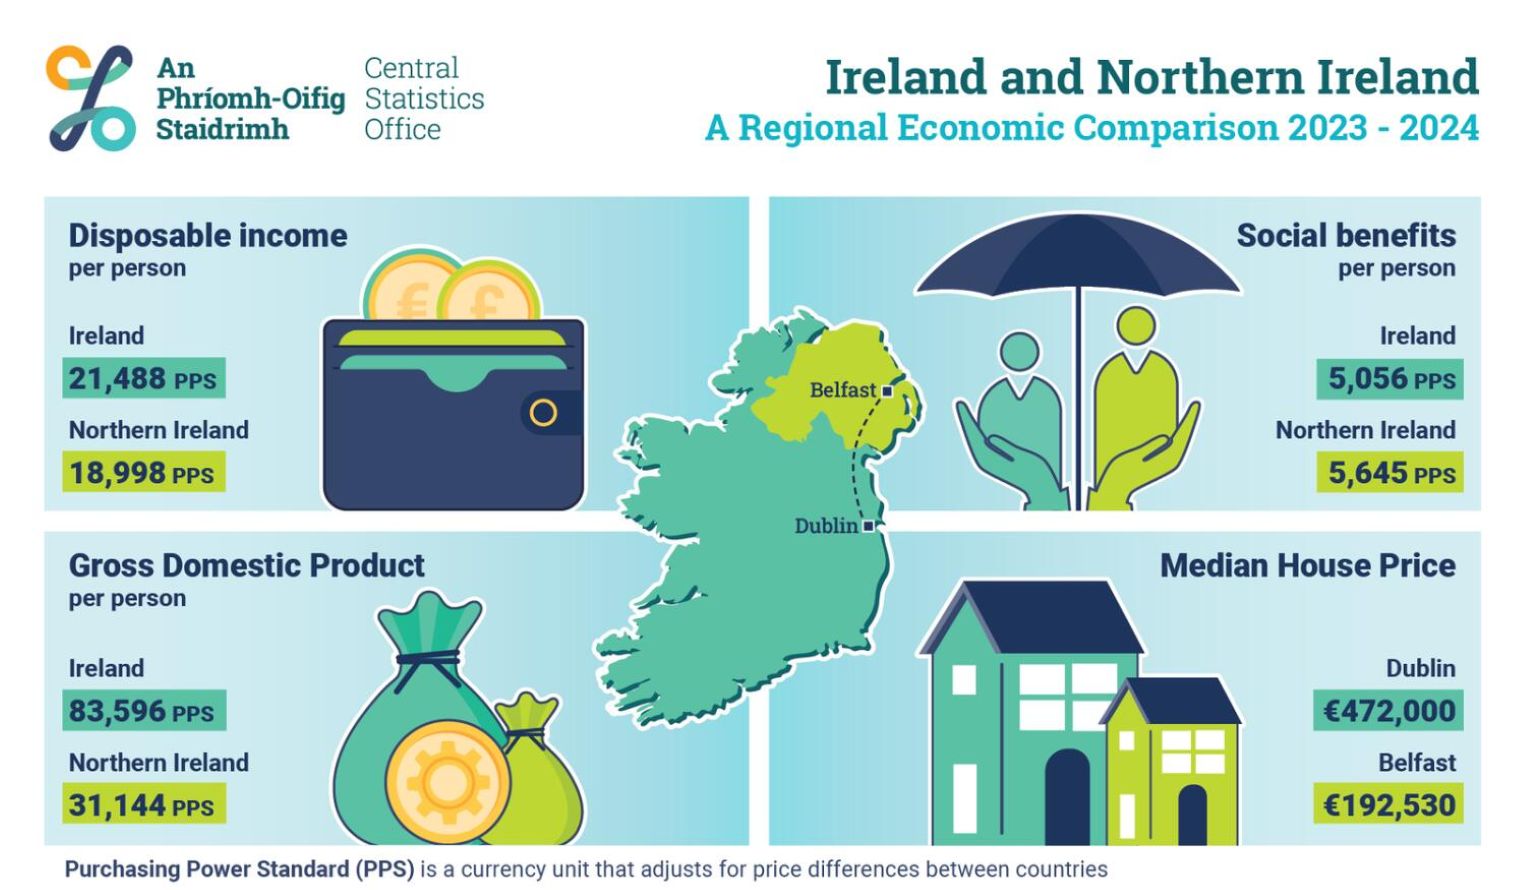
Income levels highlight a shared but uneven growth path (2023)
- Ireland: 21,488 PPS
- Northern Ireland: 18,998 PPS
- ➡️ ~13% higher disposable income in Ireland
Recent analysis of the dataset confirms that all regions in Ireland continue to outperform Northern Ireland in disposable income per person, although Northern Ireland maintains a higher proportion of income support through social transfers .
Within the DBEC geography, Dublin remains the highest-income node, reinforcing its role as the primary demand and investment driver in the southern section of the Corridor.
Housing affordability shows a stark divergence (2024)
- Dublin: median house prices more than 13× average earnings
- Belfast: median house prices around 6× average earnings
- ➡️ Housing pressure in Dublin is more than twice that of Belfast
The CSO highlights that this gap has widened significantly since 2014, driven by faster house price inflation relative to earnings in the Republic. Media analysis of the release notes that Dublin’s affordability challenge is now among the most acute in Europe, with knock-on effects for labour mobility and competitiveness across the wider corridor.
By contrast, Belfast and surrounding Northern Ireland districts continue to exhibit relatively stable affordability ratios, reinforcing their potential role in balancing spatial demand across the island economy.
Structural differences, complementary strengths (2023)
- Ireland: Manufacturing accounts for 31% of Gross Value Added (GVA)
- Northern Ireland: Public Administration, Education & Health accounts for 24% of GVA
- ➡️ Distinct but highly complementary economic profiles
The CSO release shows that Ireland’s economy is more export- and multinational-driven, while Northern Ireland has a stronger public-sector-led structure. Commentary on the report notes that this divergence is increasingly seen as complementary within a cross-border economic system, particularly where advanced manufacturing, digital services and public-sector R&D intersect.
Within DBEC, this creates a platform for specialisation rather than competition, particularly in ICT, life sciences, engineering, and public innovation systems.
Why this matters for DBEC
Taken together, the CSO data reinforces three key strategic insights:
- Scale: The combined Dublin–Belfast corridor represents a single, high-capacity economic region of over 2 million people
- Balance: Structural differences in housing and income create opportunities for complementary growth rather than duplication
- Opportunity: Sectoral diversity provides a strong foundation for innovation-led cross-border collaboration
As highlighted in wider commentary on the report, the key constraint emerging in the southern part of the island is no longer growth itself, but capacity — particularly housing, infrastructure, and labour supply in Dublin. This positions Belfast and the wider northern arc as increasingly important to the functional resilience of the broader economic system.
Access the data
- CSO publication: Central Statistics Office Ireland publication
- DBEC datasets: DBEC Corridor datasets
Stay up to date with this story on our LinkedIn and X platforms.